Density
Although map features may be available at a certain zoom, features should not be styled based on availability. Revealing too much information at a certain zoom may cause confusion or dilute your map's focus. As you design your map, consider how the density of information may increases the visual weight of the map, disturbing the visual hierarchy.
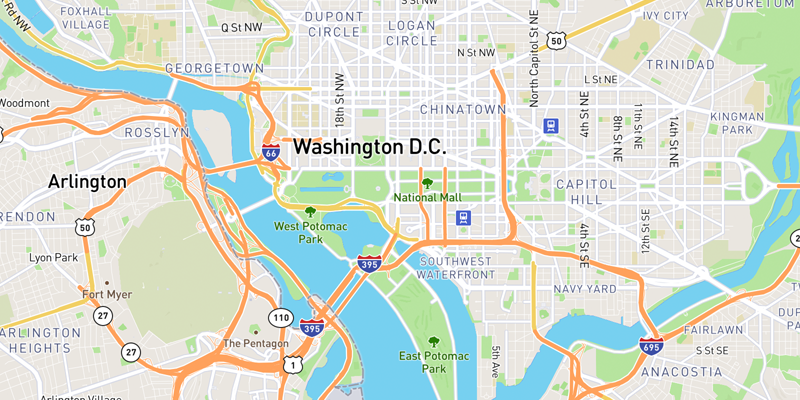
The map below shows Washington DC styled with a measured density for the points of interest or POIs. More prominent POIs are styled based on scalerank which is a field included Mapbox Streets data. scalerank is determined based on an algorithm that ranks importance based size and appended data from Wikipedia. Mapbox Streets brings in POIs ranked at 1 most important and is styled in lower priority than neighborhoods, highway shields, and transit stops. Using information like scalerank or other classifications to vary styling and priority are good ways to control density.
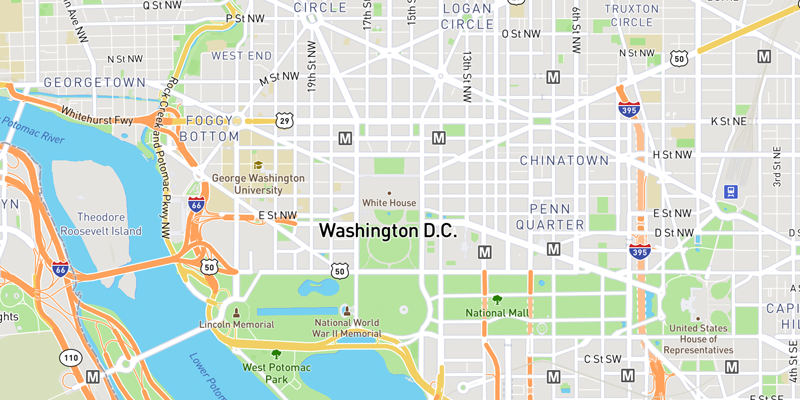
POIs grouped by scalerank and prioritized accordingly.
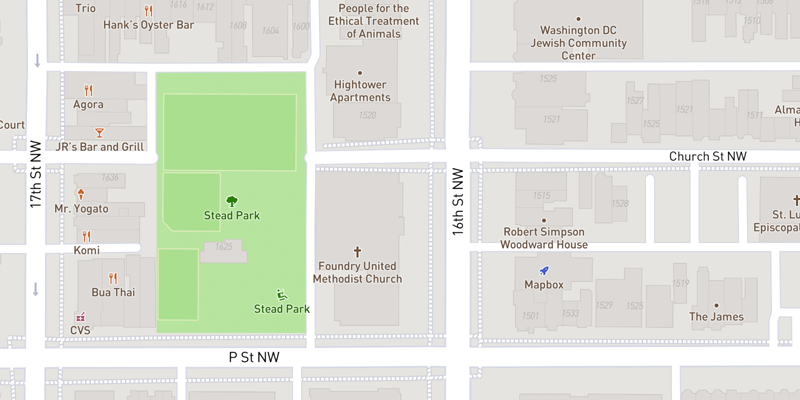
The example below groups all POIs into one layer which doesn't allow for differentiation in styling. POIs show up at city view although they may not be recognizable landmarks and add no value to the map at this level. A few of these POIs are also appearing instead of transit stops or highway shields which doesn't help navigation or wayfinding. Measured density makes your map more readable and helps focus the narrative and usability of your map.
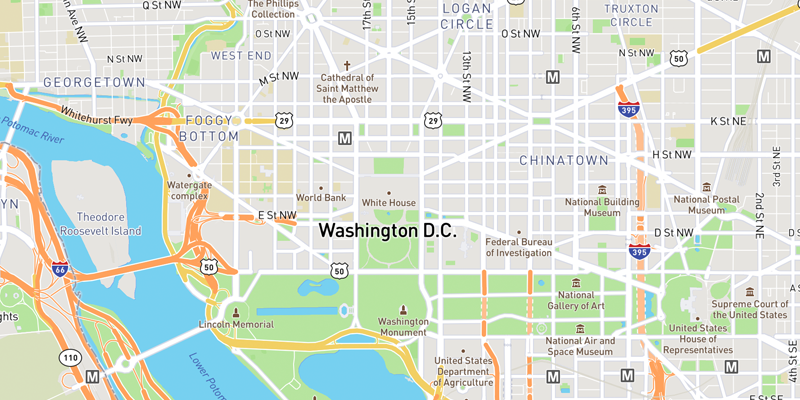
POIs styled densely with no prioritization.
Zoom levels
Web maps, as opposed to print maps, have more flexibility in what information can be shown and when, thanks to zoom levels. Users can explore the map from a global level and/or zoom into street level detail and everything in between. Zoom levels move from z0 to z22 and along the way the appropriate data is available from vector tiles to be styled.
Sometimes, it is not possible to legibly display data at a given zoom level. For example, a dense series of topographic lines would turn into a jumble of features when viewing the map at the state or regional zoom level. Conversely, styling every POI, like parks, buildings, restaurants, etc., at a city level would appear too coarse and hard to comprehend at a glance. To prevent these potential issues, the cartography team has determined optimal maximum and minimum zoom levels to make data available in our Mapbox vector tiles.

Global view z1
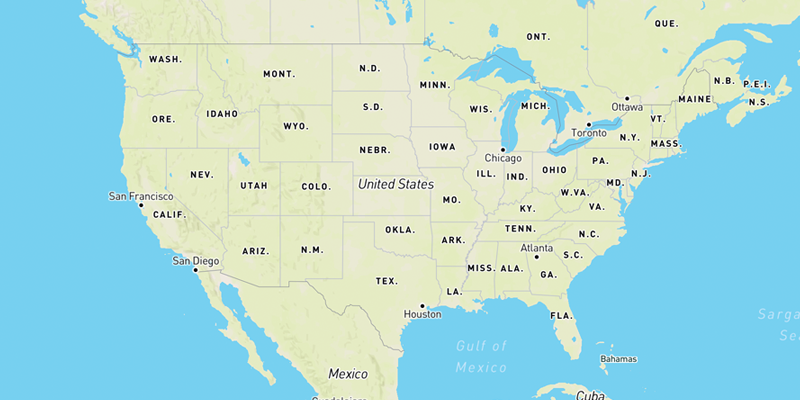
National view z3
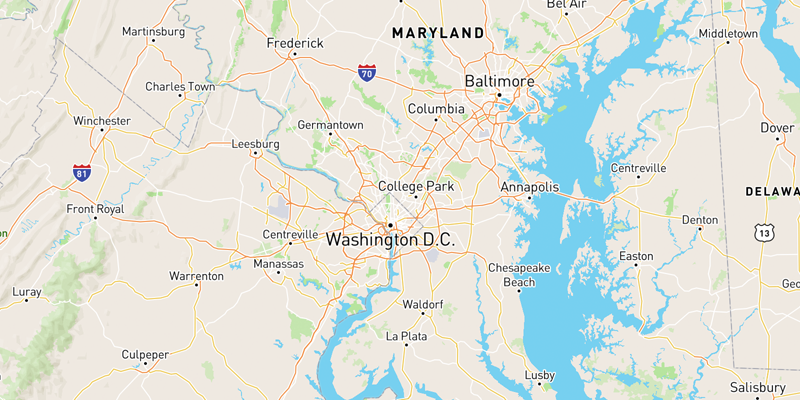
Regional view z7
City view z12
Street view z17