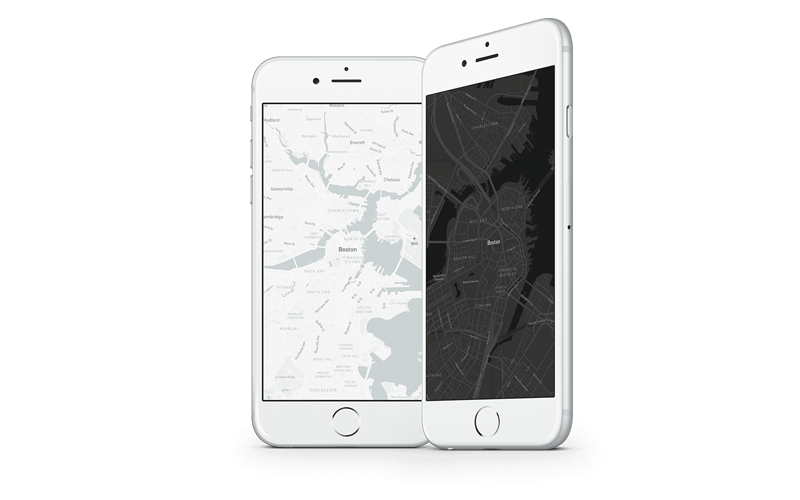
Mapbox Dark and Mapbox Light
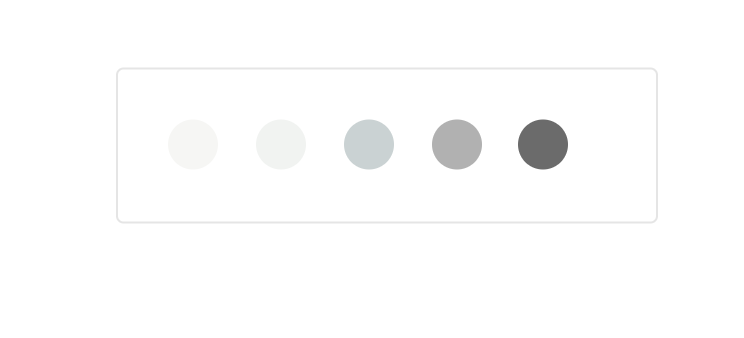
Mapbox Light and Mapbox Dark are subtle, full-featured maps designed to provide geographic context while highlighting the data on your analytics dashboard, data visualization, or data overlay. The Cartography Team created two tightly constrained color palettes that use slight shifts in hue and value to provide depth and space without overwhelming overlaid content.
Mapbox Streets data
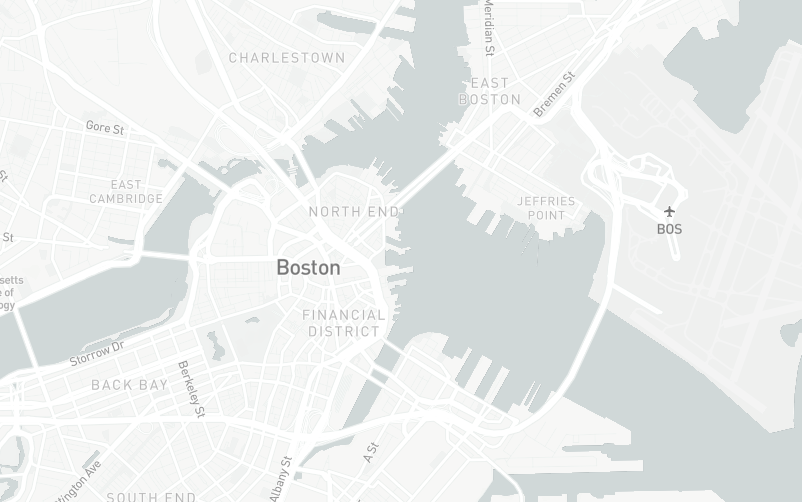
Mapbox Light and Dark use the same vector tile source as our general-purpose maps, Mapbox Streets, and contain the full range of geographic information required to provide context for overlays. Light and Dark are specially designed to show a full set of cartographic features without distracting from your content. The Cartography Team modified every element of these maps –thinning line widths, lowering label densities, reducing contrast – to make sure they always complement your project.
Additional design features
Roadways. Highly organized but more scaled back road data, designed to present a clearly legible hierarchy of the majority of road types across a wide zoom range.
Administrative boundaries. A global political and administrative boundary layer.
Built features. Building footprints, rail stations, urban parks, land use, famous landmarks, and neighborhood stores.
Natural features. Rivers, lakes, streams, oceans, coastal boundaries, parks, land cover, and beaches.
Places. A complete hierarchy of location labels, from countries and states down to villages and neighborhoods.
Terrain. Subtle hillshade complements the simple design with topography for context.